
Piktochart or Visme…?
Both platforms help you:
- Create professional-looking infographics and reports.
- Design presentations, charts, and branded visual content.
- Turn complex ideas into clean, easy-to-understand visuals.
But which is the best for your use case?
You can’t purchase both the tools. (If you have the budget and use case – sure!)
If you’re confused about which visual design platform to choose, this blog is for you!
I’ll break down each tool, compare its strengths and weaknesses, and help you find which one best fits your needs.
So, dive into this clear-cut Piktochart vs Visme showdown…
Quick Verdict: Piktochart or Visme?
Here’s the quick answer:
Choose Piktochart if you want a simple, fast, and beginner-friendly tool for creating infographics, reports, HR visuals, internal communication designs, and quick marketing assets.
Choose Visme if you need a more advanced visual content platform with interactive presentations, animations, detailed charts, embedded lead forms, analytics, stronger export options, and deeper brand control.
So, if your goal is to create clean visuals quickly without spending hours learning the tool, Piktochart is the better choice.
But if you want to build more interactive, animated, and highly branded content, Visme gives you more creative control.
Here’s a quick breakdown:
| Need | Better Choice |
| Simple infographics | Piktochart |
| Interactive presentations | Visme |
| Fast report creation | Piktochart |
| Animated/interactive content | Visme |
| Budget-friendly visual creation | Piktochart |
| Complex branded business content | Visme |
| Data-heavy charts and dashboards | Visme |
| HR/internal communication visuals | Piktochart |
Piktochart vs Visme at a Glance
Before we go deeper, here’s a quick side-by-side comparison of Piktochart and Visme.
This will help you understand where each tool stands and which one makes more sense for your workflow.
| Category | Piktochart | Visme | Winner |
| Ease of use | Simple, clean, and easier to learn | More powerful, but has more menus and options | Piktochart |
| Infographics | Purpose-built for quick infographic creation | Strong infographic features with more interactivity | Tie |
| Reports | Great for simple, professional reports | Better for highly customized reports | Tie |
| Presentations | Good for basic presentation decks | Stronger for interactive and animated decks | Visme |
| AI tools | Strong text-to-visual and document creation tools | AI design and content generation tools | Depends |
| Data visualization | Good charts, maps, and basic visual data tools | More advanced, live, and interactive data options | Visme |
| Templates | Practical templates for business, HR, and marketing | Larger template library across more content types | Visme |
| Branding | Easy brand kit for quick branded designs | More advanced brand controls for teams | Visme |
| Collaboration | Good for small teams and simple workflows | Stronger for larger teams and organizations | Depends |
| Pricing | Usually simpler and better for basic use | Higher, but with a broader feature set | Piktochart for cost, Visme for depth |
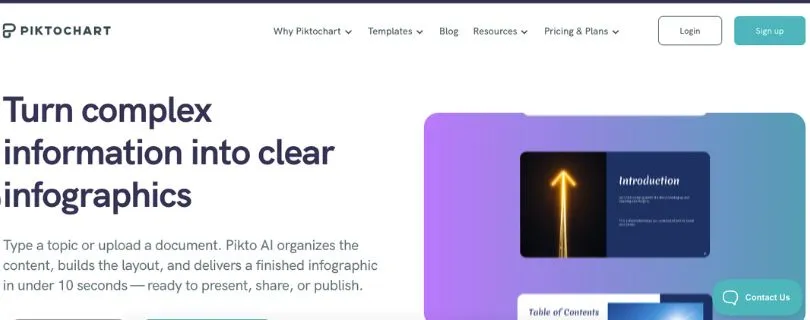
What Is Piktochart and What Is It Best For?
Piktochart is a simple visual design tool that helps non-designers create infographics, reports, presentations, posters, and business visuals without starting from scratch.
Piktochart is best for:
- Creating simple and professional infographics.
- Designing business reports and visual summaries.
- Making HR communication materials like policies, onboarding guides, and announcements.
- Creating internal company updates and team communication visuals.
- Designing classroom, nonprofit, and educational visuals.
- Making quick marketing visuals for campaigns, blogs, and social media.
- Turning text, documents, or rough ideas into visual drafts.
- Non-designers who care more about speed and clarity than deep customization.
Still comparing infographic tools? Explore the full alternatives breakdown:
Piktochart Alternatives and Competitors
What Is Visme and What Is It Best For?
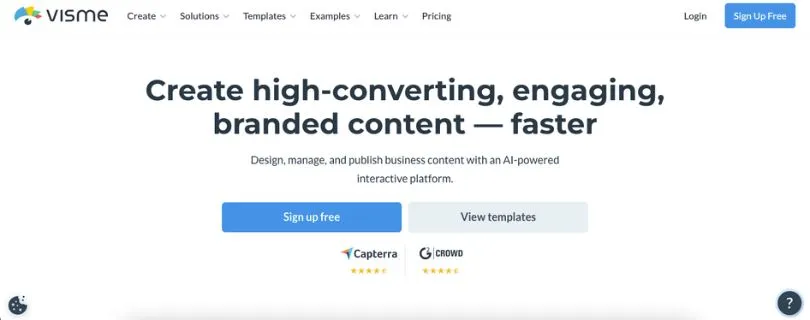
Visme is a more advanced visual communication platform for creating presentations, reports, infographics, documents, charts, videos, and branded business content.
Visme is best for:
- Creating interactive presentations with clickable elements.
- Designing animated infographics and visual content.
- Building data-heavy reports with charts, graphs, and dashboards.
- Creating lead-generation content like forms, gated assets, and branded documents.
- Designing polished business documents for clients, teams, or stakeholders.
- Making training and eLearning content.
- Creating sales decks, pitch decks, and proposals.
- Teams that need analytics, interactivity, brand control, and advanced sharing or export options.
Want to compare Visme with more design platforms?
Best Visme Alternatives
Piktochart vs Visme: Feature-by-Feature Comparison
In this section, I’ll compare Piktochart and Visme across the key features that matter when choosing a visual design tool.
This will give you a clear idea of how both platforms differ and which one fits your workflow better.
Here’s what I’ll cover:
- Ease of Use
- Infographics and Reports
- Presentations
- AI Design Tools
- Data Visualization
- Branding and Customization
- Collaboration, Sharing, and Exports
1. Ease of Use
When you’re choosing a design tool, ease of use matters a lot.
You don’t want to spend hours figuring out where the buttons are, how templates work, or how to resize a simple chart.
Both Piktochart and Visme are made for non-designers, but the learning experience is different.
Quick TL;DR of Ease of Use Comparison
| Comparison | Piktochart | Visme | Winner |
| Beginner-friendly interface | ✅ | ✅ | Piktochart |
| Faster learning curve | ✅ | ❌ | Piktochart |
| More design controls | ❌ | ✅ | Visme |
| Clean editing experience | ✅ | ✅ | Tie |
| Best for quick designs | ✅ | ❌ | Piktochart |
| Best for advanced users | ❌ | ✅ | Visme |
Piktochart’s Ease of Use vs. Visme’s Ease of Use
Piktochart feels simpler from the start.
The editor is clean, the layout is easy to understand, and most of the important tools are right where you expect them to be. You can pick a template, edit the text, change colors, add charts, and download your design without feeling lost.
That’s why Piktochart works well for people who don’t want a complicated design process.
Visme is also beginner-friendly, but it gives you more features, more menus, and more creative controls. That’s great if you want flexibility, but it can also feel a little heavier when you only need a simple infographic or report.
The difference is simple:
Piktochart helps you create faster.
Visme gives you more room to customize.
Which Tool Is Easier to Use — Piktochart or Visme?
Piktochart is easier to use overall.
If your main goal is to create clean visuals quickly, Piktochart is the better choice.
But if you’re okay with spending more time learning the tool in exchange for more design control, Visme gives you more options.
So, choose Piktochart for speed and simplicity.
Choose Visme if you want more advanced editing power.
2. Infographics and Reports
Infographics and reports are two of the biggest reasons people compare Piktochart and Visme.
Both tools can help you turn boring information into something more visual, readable, and professional.
But again, they approach the job differently.
Quick TL;DR of Infographics and Reports Comparison
| Comparison | Piktochart | Visme | Winner |
| Infographic templates | ✅ | ✅ | Tie |
| Business report templates | ✅ | ✅ | Tie |
| Fast report creation | ✅ | ❌ | Piktochart |
| Advanced design flexibility | ❌ | ✅ | Visme |
| Best for HR/internal reports | ✅ | ✅ | Piktochart |
| Best for polished client reports | ✅ | ✅ | Visme |
| Interactive report features | ❌ | ✅ | Visme |
Piktochart’s Infographics and Reports vs. Visme’s Infographics and Reports
Piktochart is very strong when it comes to simple, professional infographics.
You can use it to create visual reports, process charts, timelines, comparison graphics, employee updates, policy summaries, nonprofit reports, and marketing visuals without overthinking the design.
It’s especially useful when you already have written content and want to turn it into something visual.
For example, if you have a long HR policy document, Piktochart can help you turn it into a clean one-page visual summary.
Visme can also create infographics and reports, but it gives you more advanced options. You can add animations, interactive elements, embedded media, charts, pop-ups, and clickable sections.
That makes Visme better for reports that need to feel more polished, dynamic, or presentation-ready.
Which Tool Is Better for Infographics and Reports — Piktochart or Visme?
For simple infographics and quick reports, Piktochart is the better option.
It’s faster, cleaner, and easier for non-designers.
But if you want interactive reports, animated visuals, or more advanced design control, Visme is stronger.
So, the winner depends on your use case.
Choose Piktochart if you need to create a clear visual fast.
Choose Visme if you want to create a more detailed, branded, or interactive report.
3. Presentations
This is where the difference becomes more obvious.
Piktochart can create presentations, but Visme is much stronger in this area.
If presentations are a big part of your workflow, this section matters.
Quick TL;DR of Presentation Comparison
| Comparison | Piktochart | Visme | Winner |
| Basic slide decks | ✅ | ✅ | Tie |
| Interactive presentations | ❌ | ✅ | Visme |
| Animation options | Limited | Stronger | Visme |
| Presentation templates | ✅ | ✅ | Visme |
| Sales decks | Basic | Advanced | Visme |
| Training presentations | Basic | Stronger | Visme |
| Presentation analytics | ❌ | ✅ | Visme |
Piktochart’s Presentations vs. Visme’s Presentations
Piktochart is fine for simple presentation decks.
You can create clean slides, add visuals, use templates, and design a professional-looking deck without needing PowerPoint or Google Slides.
But Piktochart’s presentation features feel more basic compared to Visme.
Visme is built much better for interactive and animated presentations.
You can add clickable buttons, hover effects, pop-ups, transitions, videos, audio, and other interactive elements. This makes it useful for sales decks, pitch decks, training materials, product explainers, and client presentations.
Visme also makes more sense if you care about how people interact with your presentation after you share it.
For example, a sales team can use Visme to create a polished pitch deck and track how viewers engage with it.
Piktochart is more about creating simple visual slides.
Visme is more about creating presentation experiences.
Which Tool Is Better for Presentations — Piktochart or Visme?
Visme is the clear winner for presentations.
If you only need basic slides, Piktochart can do the job.
But if presentations are important to your business, Visme gives you more features, more control, and better interactive options.
So, choose Visme if you create sales decks, pitch decks, training presentations, or branded business presentations regularly.
4. AI Design Tools
AI features are becoming a big part of visual design tools.
Both Piktochart and Visme now use AI to help users create content faster, but their AI tools are useful in slightly different ways.
Quick TL;DR of AI Design Tools Comparison
| Comparison | Piktochart | Visme | Winner |
| AI infographic creation | ✅ | ✅ | Piktochart |
| AI report creation | ✅ | ✅ | Piktochart |
| AI presentation creation | ✅ | ✅ | Visme |
| Text-to-visual workflow | ✅ | ✅ | Piktochart |
| AI content/design assistant | ✅ | ✅ | Tie |
| Better for quick drafts | ✅ | ✅ | Piktochart |
| Better for advanced visual projects | ❌ | ✅ | Visme |
Piktochart’s AI Tools vs. Visme’s AI Tools
Piktochart’s AI tools are helpful if you want to turn text into visuals quickly.
You can start with a prompt, document, or idea and use AI to generate a draft for an infographic, report, or visual document. This is useful when you don’t want to stare at a blank canvas.
For example, if you need an infographic about employee wellness, you can give Piktochart a short prompt and get a visual starting point.
Visme also offers AI tools for creating presentations, documents, designs, and visual content. Its AI features fit better into a wider design workflow because Visme already has more options for animation, interactivity, branding, and publishing.
So, Piktochart’s AI feels more useful for fast text-to-visual creation.
Visme’s AI feels more useful when you want AI support inside a more advanced design platform.
Which Tool Has Better AI Features — Piktochart or Visme?
Piktochart is better if you want quick AI-generated infographics, reports, and visual drafts.
Visme is better if you want to combine AI with presentations, branded content, animations, and more advanced design projects.
So, there’s no single winner here.
Choose Piktochart for faster AI-assisted visual creation.
Choose Visme for AI features inside a broader creative workspace.
5. Data Visualization
If you create charts, graphs, dashboards, or data-heavy reports, this part is important.
Both tools support data visualization, but Visme gives you more depth.
Quick TL;DR of Data Visualization Comparison
| Comparison | Piktochart | Visme | Winner |
| Basic charts and graphs | ✅ | ✅ | Tie |
| Maps | ✅ | ✅ | Tie |
| Data-heavy reports | Good | Stronger | Visme |
| Interactive charts | Limited | ✅ | Visme |
| Live or dynamic data options | Limited | ✅ | Visme |
| Easy chart creation | ✅ | ✅ | Tie |
| Best for simple visual data | ✅ | ✅ | Piktochart |
| Best for advanced data storytelling | ❌ | ✅ | Visme |
Piktochart’s Data Visualization vs. Visme’s Data Visualization
Piktochart gives you the chart and map tools you need for simple data visuals.
You can create bar charts, pie charts, line charts, maps, and other common visuals for reports and infographics. For most HR teams, educators, nonprofits, and marketers, this is enough.
It works well when your goal is to make data easier to understand, not build an advanced dashboard.
Visme goes further.
It gives you stronger options for data-heavy content, interactive charts, dashboards, and more detailed data storytelling. If you want your audience to click, explore, or interact with the data, Visme is the better fit.
For example, if you’re creating an annual business report with multiple charts, interactive sections, and branded visuals, Visme gives you more control.
Which Tool Is Better for Data Visualization — Piktochart or Visme?
For simple charts and visual summaries, Piktochart is great.
It’s easy to use and doesn’t overcomplicate the process.
But for advanced charts, interactive data, dashboards, and data-heavy reports, Visme is better.
So, choose Piktochart if your data needs are simple.
Choose Visme if data visualization is a major part of your content strategy.
6. Branding and Customization
Branding matters when you create content for a business, team, client, or audience.
You don’t want every design to look different. You want consistent fonts, colors, logos, and templates.
Both Piktochart and Visme offer branding features, but Visme has the stronger setup for larger teams.
Quick TL;DR of Branding and Customization Comparison
| Comparison | Piktochart | Visme | Winner |
| Brand colors | ✅ | ✅ | Tie |
| Logo upload | ✅ | ✅ | Tie |
| Custom fonts | ✅ | ✅ | Tie |
| Brand kit | ✅ | ✅ | Tie |
| Advanced brand control | Basic | Stronger | Visme |
| Reusable branded templates | ✅ | ✅ | Tie |
| Best for simple brand use | ✅ | ✅ | Piktochart |
| Best for larger brand teams | ❌ | ✅ | Visme |
Piktochart’s Branding Features vs. Visme’s Branding Features
Piktochart gives you the basic branding tools most small teams need.
You can add your logo, set brand colors, use brand fonts, and create designs that look consistent. This is useful for teams creating internal updates, HR documents, simple reports, and marketing graphics.
Visme offers more advanced brand control.
It’s better if multiple people are creating content and you need to keep everything on-brand. You get more flexibility for branded templates, design systems, business documents, presentations, and team workflows.
Piktochart keeps branding simple.
Visme gives you deeper control.
Which Tool Has Better Branding Features — Piktochart or Visme?
Visme wins if your team needs advanced branding and customization.
But Piktochart is enough if you only need basic brand consistency for everyday visuals.
So, choose Piktochart for simple brand use.
Choose Visme if your brand assets need more structure, control, and flexibility.
7. Collaboration, Sharing, and Exports
A design tool is not just about creating visuals.
You also need to share them, download them, publish them, and sometimes work with other people on the same project.
This is where export and collaboration features can make a big difference.
Quick TL;DR of Collaboration, Sharing, and Export Comparison
| Comparison | Piktochart | Visme | Winner |
| Team collaboration | ✅ | ✅ | Tie |
| Comments and feedback | ✅ | ✅ | Tie |
| PDF export | ✅ | ✅ | Tie |
| Image export | ✅ | ✅ | Tie |
| Presentation sharing | Basic | Stronger | Visme |
| Interactive publishing | Limited | ✅ | Visme |
| Advanced export options | Limited | Stronger | Visme |
| Best for simple downloads | ✅ | ✅ | Piktochart |
| Best for advanced sharing | ❌ | ✅ | Visme |
Piktochart’s Collaboration and Exports vs. Visme’s Collaboration and Exports
Piktochart works well when you need to create a design, download it, and share it quickly.
You can export visuals as common file types, collaborate with team members, and keep projects organized without much friction. For most basic workflows, this is enough.
Visme gives you more advanced sharing and publishing options.
This is useful if you want to publish interactive content online, share presentations with tracking, export in different formats, or create content that goes beyond a static image or PDF.
For example, if you’re creating a simple HR announcement, Piktochart is perfect.
But if you’re creating an interactive sales presentation with animations, analytics, and sharing controls, Visme is the better choice.
Which Tool Has Better Collaboration, Sharing, and Export Options — Piktochart or Visme?
For simple collaboration and downloads, Piktochart does the job well.
But if you need advanced publishing, interactive sharing, presentation analytics, or more export flexibility, Visme is stronger.
So, choose Piktochart if you mostly need static visuals.
Choose Visme if you need more advanced ways to share, present, and track your content.
Piktochart vs Visme Pricing Comparison
Pricing is one of the biggest deciding factors, especially if you’re a solo creator, small business, marketer, educator, or HR team trying to create visuals regularly.
Both Piktochart and Visme offer free plans and paid plans, but they differ in terms of pricing, AI credits, branding features, downloads, storage, and advanced design options.
Let’s break it down.
Piktochart offers a forever-free plan and paid plans:
- Free – $0
- Pro – $14/month/member, billed annually
- Business – $24/month/member, billed annually
- Enterprise – Custom pricing for larger teams
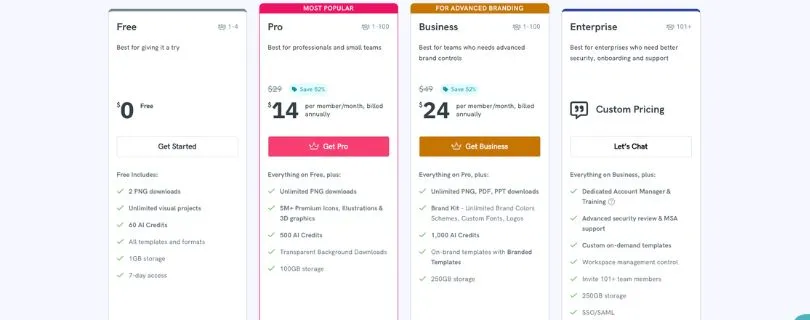
Piktochart’s free plan includes unlimited visual projects, 2 PNG downloads, 60 AI credits, all templates and formats, and 1GB storage. Its Pro plan costs $168/year, while Business costs $288/year per member when billed annually.
Similarly, Visme also offers a free plan and paid plans:
- Basic – Free
- Starter – $12.25/month/user, billed annually
- Pro – $24.75/month/user, billed annually
- Enterprise – Custom pricing
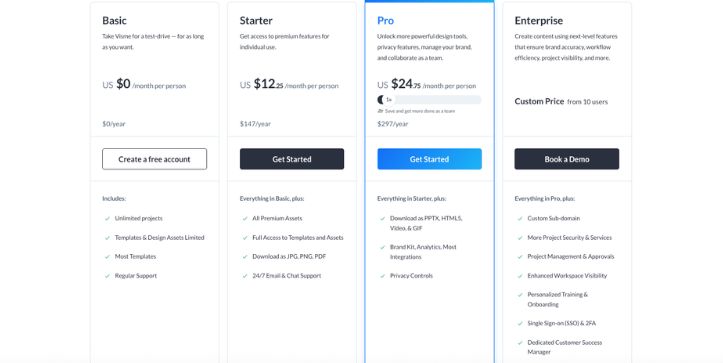
Capterra’s current Visme pricing page lists the Starter yearly plan at $12.25/user/month and the Pro yearly plan at $24.75/user/month. It also lists monthly options at $29 for Starter and $59 for Pro.
Key Difference Between Piktochart and Visme Pricing Plans
With Piktochart, the pricing feels more straightforward.
You get a simple path from Free to Pro to Business, and the main differences are around downloads, storage, AI credits, branding features, and team needs.
This makes Piktochart easier to understand if you only need a tool for infographics, reports, HR visuals, internal communication, or quick marketing designs.
Visme, on the other hand, is priced more like a broader visual communication platform.
You’re not just paying for basic design creation. You’re also paying for features like interactive content, advanced presentation options, analytics, premium assets, privacy controls, integrations, and more export formats on higher plans.
So, if you only need simple visuals, Visme may feel like more tool than you need.
But if your team creates presentations, branded business documents, interactive reports, videos, lead-generation content, and data-heavy visuals, Visme’s higher pricing can make sense.
Another key difference is branding.
Piktochart keeps brand features simple and practical, especially for small teams.
Visme gives you deeper brand control, which is more useful for larger teams that need consistent presentations, reports, sales decks, and client-facing documents.
So, choose Piktochart if you want a simpler and more affordable visual design tool.
Choose Visme if you’re willing to pay more for advanced features, interactivity, analytics, and stronger creative control.
Want the full Visme plan-by-plan cost breakdown before choosing?
Visme Pricing Explained
Final Verdict – Which Is Better: Piktochart or Visme?
After breaking down the features, pricing, use cases, and overall workflow, it’s time to pick the winner. (Not as easy as it sounds!)
Quite honestly – there’s no one-size-fits-all answer.
Piktochart is the better pick if you want a simple, fast, and beginner-friendly tool for creating infographics, reports, HR visuals, internal updates, and quick marketing content.
It doesn’t overwhelm you with too many design controls, and that’s actually its biggest strength.
You can open a template, add your content, adjust the design, and publish something professional without spending half your day inside the editor.
That said, Visme is the stronger choice if you need more advanced creative control.
It’s better for interactive presentations, animated content, data-heavy reports, branded business documents, lead-generation assets, and teams that need more sharing, analytics, and export options.
But if you only need simple infographics or quick reports, Visme may feel heavier than necessary.
And even with Piktochart, you may feel limited if your projects need animation, interactivity, or advanced presentation features.
So, here’s the simple answer:
Choose Piktochart if you want speed, simplicity, and clean visual communication.
Choose Visme if you want deeper customization, interactive content, and a more advanced visual design platform.
With Piktochart, you can:
- Create infographics quickly.
- Design business reports and HR visuals.
- Turn text or documents into visual drafts.
- Make internal communication content.
- Build clean marketing visuals without much design experience.
With Visme, you can:
- Create interactive presentations.
- Add animations and clickable elements.
- Build data-heavy reports and dashboards.
- Design branded sales decks and business documents.
- Use advanced sharing, analytics, and export options.
So, instead of asking which tool is better overall, ask this:
Do you want to create simple visuals faster?
Go with Piktochart.
Do you want more power, control, and interactivity?
Go with Visme.
FAQs About Piktochart vs Visme
1. Is Piktochart better than Visme?
Piktochart is better if you want a simple tool for infographics, reports, HR visuals, and quick business content.
Visme is better if you need interactive presentations, animations, advanced charts, and more design control.
2. Is Visme better than Piktochart?
Visme is better for advanced visual projects.
If your work involves sales decks, animated infographics, branded business documents, or interactive reports, Visme gives you more flexibility than Piktochart.
3. Which tool is easier to use, Piktochart or Visme?
Piktochart is easier to use.
Its editor feels cleaner, faster, and less overwhelming, especially for beginners and non-designers.
4. Which is better for infographics?
Piktochart is better for creating simple and professional infographics quickly.
Visme is also strong, but it makes more sense when you want animations, clickable elements, or a more customized design.
5. Which is better for presentations?
Visme is the better choice for presentations.
It gives you more options for animations, interactivity, transitions, embedded media, and branded presentation experiences.
6. Which tool is better for reports?
Both tools are good for reports, but the use case matters.
- Choose Piktochart for simple business reports and visual summaries.
- Choose Visme for interactive, data-heavy, or highly branded reports.
7. Which has better AI features, Piktochart or Visme?
Piktochart is better for quickly turning text, prompts, or documents into visual drafts.
Visme is better if you want AI support inside a broader design platform with presentations, documents, animations, and branding features.
8. Which is cheaper, Piktochart or Visme?
Piktochart usually feels more affordable for basic visual creation.
Visme costs more on higher plans, but it also gives you more advanced features like interactivity, analytics, presentation tools, and stronger export options.
9. Can Piktochart replace Visme?
Piktochart can replace Visme if your main work is creating infographics, reports, internal visuals, and simple marketing content.
But if you use Visme for interactive presentations, animated content, or advanced branded assets, Piktochart may feel limited.
10. Can Visme replace Piktochart?
Yes, Visme can replace Piktochart for most visual design needs.
But if you prefer a simpler, faster, and less cluttered workflow, Piktochart may still feel better for everyday infographic and report creation.
11. Which one is better for HR teams?
Piktochart is usually better for HR teams.
It works well for onboarding guides, policy summaries, employee announcements, internal reports, training visuals, and company updates.
12. Which one is better for marketing teams?
It depends on the type of marketing content you create.
- Use Piktochart for quick campaign visuals, infographics, and simple reports.
- Use Visme for lead magnets, sales decks, interactive content, and branded presentations.
13. Which is better for data visualization?
Visme is better for advanced data visualization.
Piktochart handles basic charts and maps well, but Visme gives you more options for interactive charts, dashboards, and data-heavy visual storytelling.
14. Is Piktochart good for non-designers?
Yes, Piktochart is one of the better choices for non-designers.
You don’t need strong design skills to create clean infographics, reports, posters, or internal communication visuals.
15. Is Visme good for beginners?
Yes, Visme is beginner-friendly, but it has a slightly longer learning curve than Piktochart.
It gives you more features, which is great for advanced work, but beginners may need more time to explore the editor.
16. Which tool is better for business documents?
Visme is better for polished business documents, proposals, sales decks, and client-facing content.
Piktochart is better for simpler reports, summaries, and internal business visuals.
17. Should I use Piktochart or Visme for social media graphics?
Both tools can create social media graphics.
Piktochart is better for quick, clean visuals, while Visme is better if you want animated posts, branded assets, or more polished campaign content.
18. What is the biggest difference between Piktochart and Visme?
The biggest difference is simplicity vs. control.
Piktochart focuses on speed and ease of use, while Visme gives you more advanced design, animation, presentation, and interactivity features.
19. Who should choose Piktochart?
Choose Piktochart if you want to:
- Create infographics fast.
- Make simple reports.
- Design HR and internal communication visuals.
- Turn text into visual drafts.
- Avoid a steep learning curve.
20. Who should choose Visme?
Choose Visme if you want to:
- Build interactive presentations.
- Create animated infographics.
- Design branded business documents.
- Work with advanced charts and reports.
- Use analytics, sharing controls, and richer export options.
21. What is the best alternative to Piktochart and Visme?
Canva is the best general alternative for social media graphics and everyday design.
Venngage is strong for infographics, Infogram is better for data-heavy visuals, and Adobe Express is useful for quick branded content.
Also Read:
22. Which one would I personally choose?
If I needed fast infographics and reports, I’d choose Piktochart.
If I needed interactive presentations, animated content, and stronger business design features, I’d choose Visme.