
Piktochart has earned a solid place in the visual content creation space, especially for people who want to create infographics, presentations, and reports without a steep learning curve. Its clean interface, ready-made templates, and drag-and-drop tools make it a familiar choice for marketers, educators, and small teams that need to turn ideas or data into clear visuals quickly.
That said, Piktochart is not always the perfect fit. Some users run into limits around design flexibility, advanced AI support, or collaboration features. Others want access to a broader range of templates, more export control, or tools that go beyond static visuals into animations, videos, or interactive content. Pricing can also feel restrictive for users who expect more customization or power at the same cost.
If you are exploring options beyond Piktochart, this guide walks through six of the best Piktochart alternatives to consider in 2026. Each platform is broken down by its strengths, limitations, and ideal use cases so you can confidently choose the tool that fits your content goals, workflow, and team size.
A quick comparison of the top Piktochart alternatives
For those of you who just want the highlights, here’s a quick rundown of the tools we’ll be covering.
| Tool | Best For | Key Strength | Starting Price |
| Canva | All-around content creation | Massive template library with AI-powered design | Free, Paid from $12.99/month |
| Visme | Interactive presentations & reports | Advanced interactivity and analytics | Free, Paid from $12.25/month |
| Venngage | Infographics and data storytelling | Easy-to-use editor focused on visual data | Free, Paid from $10/month |
| Infogram | Live data visualizations | Real-time charts and dashboard visuals | Free, Paid from $19/month |
| Adobe Express | Quick social media and branded visuals | Multimedia support with Adobe-quality templates | Free, Paid from $9.99/month |
| Google Slides | Collaborative presentations | Seamless team editing and integration with Google Workspace | Free |
What are the challenges with Piktochart and why existing users are looking for alternatives?
1. Limited Design Flexibility for Advanced Customization
While Piktochart is great for quick visuals, many users hit a wall when trying to push beyond the basics. Custom layouts, complex animations, and design precision often feel restricted. For creators who want more freedom to fine-tune or brand visuals deeply, this can be frustrating.
Source of Information: G2 reviews, User feedback on Reddit
2. Outdated Templates and Lack of Variety
Some users feel that Piktochart’s template library hasn’t evolved much over time. There’s repetition in design styles, and many templates don’t reflect modern visual trends. If you’re creating content regularly, it can start to feel stale and repetitive.
Source of Information: Capterra, YouTube user reviews
3. Weak Collaboration and Team Features
Piktochart doesn’t offer robust tools for teams working together in real time. There’s no live collaboration or in-document commenting, which makes workflows slower for marketing teams, agencies, or remote groups managing projects together.
Source of Information: Trustpilot, ProductHunt discussions
4. No Native AI-Powered Design Assistance
Unlike newer tools that bring in AI to automate layout suggestions or generate visual drafts, Piktochart still relies heavily on manual editing. This makes it slower for users who want to streamline content creation or repurpose assets at scale.
Source of Information: Blog comparisons, LinkedIn reviews
5. Limited Export Options in Free and Mid-Tier Plans
Users on lower-tier plans often find that key export formats are locked behind a paywall. Whether it’s high-res PDFs, PowerPoint files, or interactive embeds, the lack of export flexibility can interrupt workflows or force unwanted upgrades.
Source of Information: Capterra, User reports in forums
6. Performance Lag with Larger Visuals or Reports
When working on dense visuals or multi-page reports, some users notice the platform slowing down or freezing. This can affect productivity, especially when working on tight deadlines or presenting live.
Source of Information: G2, TrustRadius, direct user feedback
How I evaluated the best Piktochart alternatives
To actually make this list useful, I didn’t just chase shiny features or brand names. I looked at what really matters when you’re trying to create great visuals that work in the real world. Whether you’re building reports for clients, pitching with presentations, or turning complex data into something people understand, here’s what I focused on:
Design Flexibility and Creative Control
How much can you actually customize? I looked at how easy it is to adjust layouts, change styles, and create something that feels on-brand without needing to fight the editor. If you’re stuck dragging the same few blocks around or can’t get precise with your designs, that’s a red flag.
Content Variety and Output Options
A good tool should let you create more than just infographics. I looked for platforms that support presentations, social media graphics, reports, interactive visuals, and even light video content. Bonus points if you can export in different formats without limitations.
Collaboration and Workflow Tools
Can teams work together smoothly? I checked whether the platform supports real-time editing, shared workspaces, commenting, or approval flows. These are the features that matter when more than one person is touching the same project.
AI and Automation Features
With AI speeding up design workflows everywhere, I looked for tools that offer smart suggestions, auto-layouts, and content generation features. The idea is to save time without sacrificing quality — especially for users creating a lot of content under tight deadlines.
Ease of Use vs. Depth
The best tools find that sweet spot between being beginner-friendly and powerful enough for pros. I prioritized platforms that don’t take weeks to learn but still give you room to grow and create more complex visuals when needed.
Pricing Clarity and Value
No one likes surprise paywalls or weird credit systems. I focused on tools with transparent pricing, fair free tiers, and upgrade plans that actually make sense based on what you’re getting. Good design tools should help your workflow, not nickel-and-dime you.
The 6 Best Piktochart Alternatives for Creating Stunning Visual Content in 2026
Alright, let’s get into the details. Each of these tools takes a different approach to fixing the limitations users often run into with Piktochart. Whether you’re making data-heavy infographics, interactive presentations, or branded reports that actually stand out, there’s something here for every kind of content creator.
1. Canva
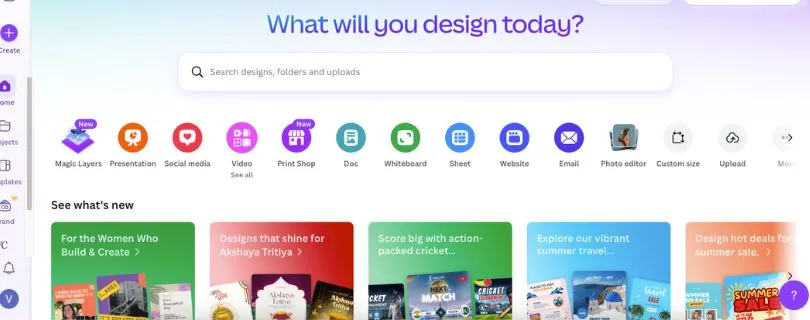
Canva is probably the most well-known name in this space, and for good reason. It’s built to let anyone, from solo entrepreneurs to marketing teams, design polished visuals without needing a design degree. Compared to Piktochart, Canva goes much further in terms of content variety, creative control, and AI assistance.
Key Features:
- AI Magic Tools: From one-click background removers to AI-generated layouts and Magic Write for copy, Canva packs in features that speed up creation without cutting corners.
- Massive Template Library: You’ll find templates for everything including social posts, presentations, pitch decks, videos, and resumes.
- Brand Kit & Teams: Great for keeping visuals consistent across your team with saved brand colors, logos, and fonts.
- Cross-Platform App: Available on web, desktop, and mobile, which makes it easy to design on the go.
Pros and cons of using Canva
Pros:
- Intuitive drag-and-drop editor that’s easy for anyone to use
- Extremely versatile with support for presentations, videos, documents, and more
- AI tools that help save time without sacrificing quality
- Strong support for teams and brand consistency
Cons:
- Some features like premium templates or high-res exports are locked behind the paid plan
- Overuse of templates can lead to designs that feel a bit generic if not customized
Pricing:
- Free: Includes thousands of templates and design elements
- Pro: $12.99/month for unlimited premium assets, AI tools, and brand kits
- Teams: Starts at $14.99/month per user with advanced collaboration features
Best for:Marketers, content creators, and small teams who need fast, polished visuals across a range of formats
Piktochart alternative for:Users who want more creative freedom, better AI tools, and a wider variety of content types beyond just infographics
2. Visme
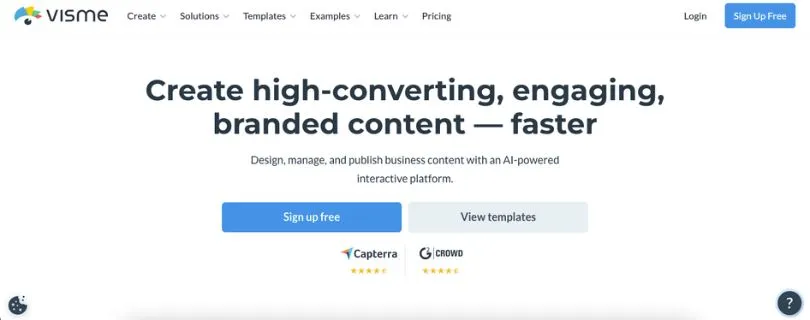
Visme is a powerhouse when it comes to creating more interactive and data-driven content. Unlike Piktochart, which focuses mainly on static visuals, Visme gives you tools to add motion, animation, and even clickable elements to your presentations, infographics, and reports.
Key Features:
- Interactive charts, maps, and animations that go beyond static design
- Presentation mode for sharing slides directly or embedding them online
- Analytics tracking to see how your audience engages with your content
- Custom branding and team libraries for enterprise users
Pros and cons of using Visme
Pros:
- Excellent for turning boring data into engaging visuals
- Strong animation support for presentations and infographics
- Includes real-time analytics on shared content
- Team collaboration tools scale well for larger groups
Cons:
- Steeper learning curve than simpler tools like Canva or Piktochart
- Free plan has heavy restrictions on downloads and branding
Pricing:
- Free: Limited templates and storage with Visme branding
- Starter: $12.25/month for individual users with access to premium templates
- Pro: $24.75/month with advanced features like analytics and interactivity
- Teams: Custom pricing with centralized control, SSO, and roles
Also Read:
Visme Pricing Explained
Best for:Educators, marketers, and enterprise teams who need to create dynamic, interactive visual content
Piktochart alternative for:Users who want to go beyond flat visuals and add interactivity, motion, and engagement tracking to their content
Also Read:
Top Visme Alternatives
3. Venngage
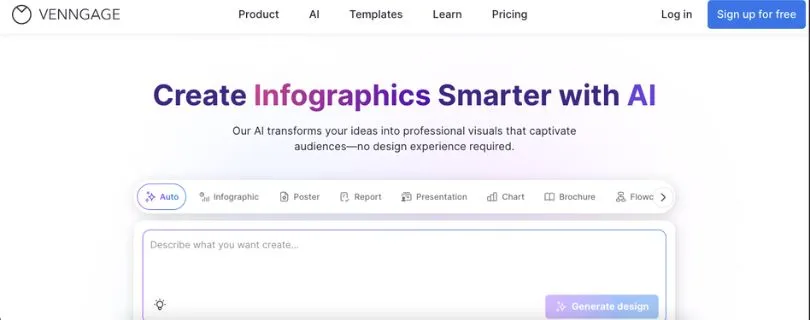
Venngage has carved out a space as a go-to tool for building infographics and visual reports. If you’re looking for something focused and easy to pick up without a design background, this one hits the mark. While it doesn’t cover as many content types as Canva or Visme, it delivers where it counts — making data digestible.
Key Features:
- Drag-and-drop infographic builder made specifically for non-designers
- Dozens of pre-built templates for timelines, process charts, and statistical visuals
- Color palette and font suggestions to help with design decisions
Pros and cons of using Venngage
Pros:
- Super beginner-friendly, especially for infographic use cases
- Helpful template categories sorted by industry and format
- Offers real-time collaboration on higher-tier plans
Cons:
- Exports limited on the free plan
- Not ideal for creating social media graphics or complex presentations
- Custom branding only available on paid tiers
Pricing:
- Free: Basic infographics with limited export options
- Premium: $10/month for higher-res downloads and more templates
- Business: $24/month includes brand kits, team sharing, and exports to PowerPoint
Best for:Small businesses, students, and educators who need clean, informative visuals without design experience
Piktochart alternative for:Users focused on infographics and visual reporting who want a simpler, more guided experience
4. Infogram
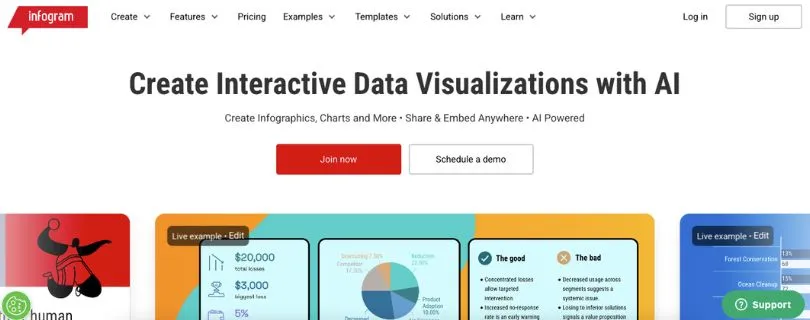
Infogram is built for users who live in the world of charts, graphs, and data visualization. If your goal is to take raw numbers and make them not just understandable but engaging, Infogram delivers. It’s especially handy for reports, dashboards, and live data embeds, which gives it an edge over tools like Piktochart that focus more on static design.
Key Features:
- Real-time data updates from Google Sheets, Dropbox, and live sources
- Over 35 chart types including interactive maps and dashboards
- Embed support for websites, blogs, and intranets
- Collaboration tools for team editing
Pros and cons of using Infogram
Pros:
- Built specifically for data-heavy content
- Interactive charts and maps that go beyond basic visuals
- Supports live data connections for up-to-date content
Cons:
- Design options feel limited outside of charts and graphs
- Interface can feel clunky for general-purpose design work
Pricing:
- Free: Includes basic charts and public projects
- Pro: $19/month for interactive charts and private projects
- Business: $67/month with analytics, team features, and premium assets
- Enterprise: Custom pricing with custom branding and onboarding
Best for:Data analysts, publishers, and corporate teams that need powerful visualizations backed by real-time data
Piktochart alternative for:Users who want advanced charting features, interactive dashboards, or live data visuals in their content
5. Adobe Express
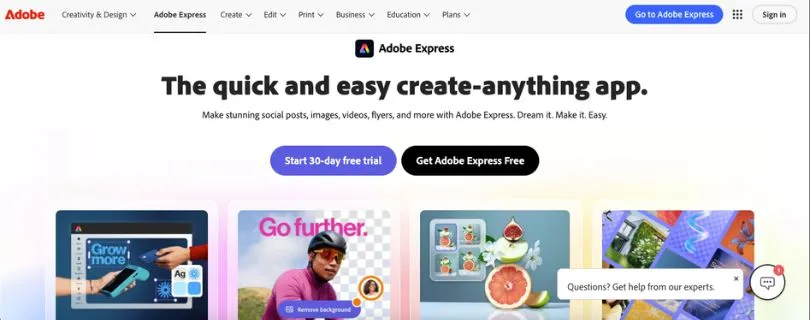
Adobe Express (formerly Adobe Spark) is part of the Adobe ecosystem, but it’s designed to be simple and accessible — even for non-designers. It’s especially strong when it comes to creating branded content quickly for social media, marketing campaigns, or client work. While it doesn’t specialize in infographics, it can definitely hold its own for visual storytelling.
Key Features:
- Ready-made templates for social posts, flyers, and short videos
- Built-in access to Adobe Fonts, Stock photos, and design assets
- Quick actions like background removal, resizing, and video trimming
- Integration with Creative Cloud for seamless asset sharing
Pros and cons of using Adobe Express
Pros:
- Clean and intuitive interface with powerful Adobe quality
- Great for quick turnaround social and marketing visuals
- Access to premium fonts, photos, and assets included
Cons:
- Limited support for complex infographics or data charts
- Best features tied to Adobe ecosystem, which may not appeal to everyone
Pricing:
- Free: Basic templates, fonts, and quick tools
- Premium: $9.99/month includes all templates, assets, and brand features
Best for:Creators, freelancers, and marketers who need fast, high-quality visuals for online and print use
Piktochart alternative for:People looking for a more polished, design-forward platform for everyday graphics with Adobe-grade quality
6. Google Slides
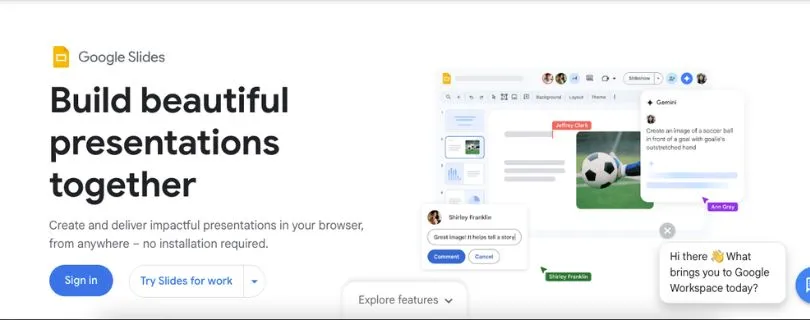
Google Slides isn’t a design tool in the traditional sense, but it’s incredibly effective for teams that prioritize collaboration and speed. When paired with smart add-ons and custom templates, it becomes a surprisingly strong alternative for presentation-heavy use cases. Plus, it’s free and already familiar to most people.
Key Features:
- Real-time collaboration with commenting and version control
- Cloud-based access across all devices
- Easy embedding of charts, images, and videos
- Integration with Google Workspace apps like Docs, Sheets, and Drive
Pros and cons of using Google Slides
Pros:
- Instant collaboration with teammates or clients
- Simple learning curve with no extra setup
- Works perfectly in Google-heavy workflows
Cons:
- Not built for design-first users
- Visual customization is limited compared to Canva or Visme
Pricing:
- Free: Includes all features for individuals
- Google Workspace Plans: Start at $6/month per user for business tools and admin controls
Best for:Educators, teams, and remote collaborators who prioritize real-time editing and simple, clean presentations
Piktochart alternative for:Users who need live collaboration and already work heavily within the Google ecosystem
How to choose the right Piktochart alternative for you
Feeling a bit overwhelmed? Totally normal. The right tool really depends on what you’re creating and how you like to work. Here’s a quick breakdown to help you figure out what fits best:
- If you’re a marketer or small business ownerYou probably need visuals fast without hiring a designer. Canva gives you the flexibility to create everything from Instagram posts to pitch decks, all in one place. It’s the easiest all-in-one solution if speed and brand consistency matter.
- If you’re building data-heavy reports or dashboardsInfogram or Visme will be more up your alley. They’re both great at turning raw numbers into clean, interactive visuals that actually make sense to your audience.
- If you’re focused on infographics and educational visualsVenngage is super beginner-friendly and purpose-built for this. It’s a solid pick for teachers, students, and anyone who needs to communicate ideas clearly with timelines, processes, or comparisons.
- If you’re a content creator or freelancer making social media visualsAdobe Express gives you high-quality templates and tools with a creative edge. It’s ideal for anyone who wants polished graphics without going deep into design software.
- If you’re part of a remote team or regularly collaborate on presentationsGoogle Slides is a smart pick. It’s not the flashiest option, but it’s reliable, easy to share, and built for real-time teamwork.
- If your team needs interactive presentations with branded contentVisme offers strong collaboration features and lets you add interactivity, animations, and custom branding at scale. It’s great for agencies or internal comms teams.
Final Thoughts
Piktochart is still a solid option for quick infographics and clean presentations, but it’s not the only player in the game. Depending on your workflow, content goals, and how much creative control you want, there might be a better fit out there that saves you time or gives you more flexibility.
Whether you’re leaning toward Canva for its all-in-one power, Visme for interactive storytelling, or something more focused like Venngage or Infogram, the best choice is the one that actually fits how you work. Try a few, explore what feels right, and go with the one that helps you create without the friction.
FAQs
Why should I consider Piktochart alternatives if it already covers infographics and presentations?
Piktochart does a great job with basic visuals, especially for infographics and reports. But if you need more advanced features like AI design tools, better branding control, or support for different content formats like video or interactive dashboards, it starts to feel limited. Alternatives like Canva, Visme, and Infogram bring more power, variety, and flexibility to the table — which can save you time and unlock more creativity.
How do I figure out which Piktochart alternative fits my needs best?
It depends on what you’re trying to make and how you like to work. Here’s a quick cheat sheet:
- Canva – Great if you want one tool for everything: social posts, documents, videos, and more
- Visme – Ideal for interactive presentations and branded team content
- Venngage – Best for simple infographic creation with guided templates
- Infogram – Your pick if data visualization is the priority
- Adobe Express – Strong for marketing visuals and social content
- Google Slides – Solid choice for teams working in real time
Think about your workflow and how much design control or automation you need, and go from there.
Are all Piktochart alternatives beginner-friendly, or do some require design experience?
Most of them are designed with non-designers in mind. Canva, Venngage, and Adobe Express are especially easy to pick up. Tools like Visme and Infogram offer more advanced options, which can take a little longer to learn but are still manageable with basic skills.
If you’re new to visual design, starting with Canva or Venngage is a safe bet. They guide you through the process and help you avoid overwhelm.
Do any of these tools offer better collaboration features than Piktochart?
Yes, several of them do. Collaboration is an area where Piktochart lags a bit.
- Canva for Teams supports real-time editing, shared folders, and brand kits
- Visme offers team spaces, permission roles, and review workflows
- Google Slides is built around live collaboration with commenting and version history
If you’re working with others or need client approvals, these tools can really streamline the back-and-forth.
Can I integrate these alternatives into my existing workflow or platforms?
Some of them integrate better than others. For example:
- Canva connects with tools like Slack, Google Drive, and HubSpot
- Visme supports embeds, CRMs, and team sharing links
- Infogram allows you to connect live data sources like Google Sheets and databases
- Google Slides naturally fits into the Google Workspace suite
If integration is key for your workflow, it’s worth checking each tool’s app connections before committing.
Are there free versions or trials available to test these tools?
Yes, almost all of them offer a free tier or at least a trial version:
- Canva: Free plan with access to thousands of templates
- Visme: Free version with limited exports and features
- Venngage: Basic plan allows you to create and share infographics
- Infogram: Free for public projects
- Adobe Express: Free with access to templates and stock photos
- Google Slides: Completely free with a Google account
You can try out multiple platforms before deciding which one feels best for your needs.
Which tools are best suited for scaling with a growing team or business?
If you’re planning to scale, focus on tools that offer strong team features, brand controls, and admin tools. Here are a few that are better suited for growth:
- Visme for Teams: Custom branding, analytics, user roles, and centralized content libraries
- Canva Teams: Great for managing larger teams with style guides and approval flows
Google Slides with Workspace: Works well in enterprise environments for shared presentations and document access