Piktochart keeps earning its spot as a go-to design tool for anyone who needs to turn ideas and data into visuals that actually make sense and look good doing it.
What is Piktochart really? How does it work behind the scenes? What’s new with its AI-powered features, and is the paid version actually worth it compared to all the free tools out there?
This honest guide covers everything you need to know. You’ll get a clear look at how Piktochart works, what it does best, what’s been updated for 2026, where it might fall short, and how real users are getting results with it.
No fluff. Just the details you need to decide if Piktochart fits your workflow.
What is Piktochart?
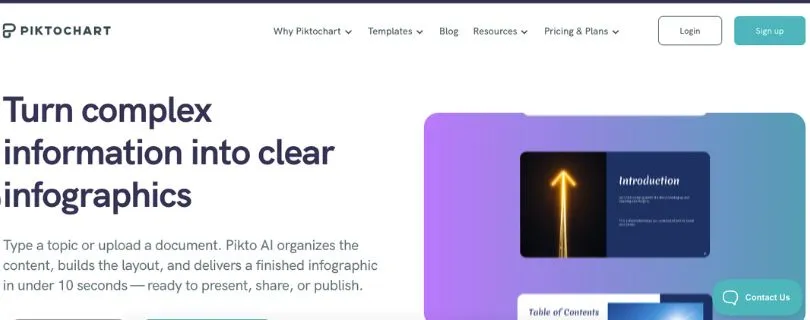
Piktochart AI is a smart visual design assistant built into the Piktochart platform. Instead of starting from scratch or dragging blocks around endlessly, users can now describe what they want to create in plain English and let the AI take the first swing. The tool quickly generates editable visuals that are tailored to your content, layout needs, and design goals.
For example, if you type “Create a marketing infographic comparing 2023 and 2024 performance metrics,” Piktochart AI can generate:
- Infographic layouts based on real data input
- Pre-filled charts and graphs using your text or spreadsheet
- Design themes that match your brand or content tone
- AI-suggested visuals, icons, and image placeholders
- Editable text blocks with attention to hierarchy and readability
What sets Piktochart AI apart is that it’s not trying to be a general-purpose AI designer. It’s tuned specifically for non-designers who need to communicate clearly with visuals, fast. Whether you’re building a slide deck, a one-pager, or a report full of charts, the AI takes care of the heavy lifting while leaving you in full control of the final design.
Key highlights:
- No need to manually adjust templates or search for icons
- Smart visual suggestions based on your topic or dataset
- Editable output designed for infographics, reports, and slides
- Built-in chart and data handling, ready for real-world use
- Brand customization options that actually stick across projects
- Works with your content, not just dummy text or random images
Also Read:
What is Napkin AI? Everything you need to know
How Piktochart Works (Step-by-Step)
This step-by-step flow gives you a clear idea of what it’s like to actually use Piktochart, from the first click to the final download.
Step 1: Describe what you want to create
Once you log in, you’re greeted with a clean dashboard and a simple prompt:
“What do you want to design today?”
You can either type something like:
“A quarterly report with charts, KPIs, and team highlights”or choose from templates like infographics, presentations, posters, or reports.
Piktochart then suggests a starting layout that fits your project goal.
Step 2: Let the AI draft your visual
Piktochart AI gets to work and builds your base design. Depending on your input, it can auto-generate:
- Slide or page layouts
- Text sections with suggested structure
- Charts and graphs linked to your data
- Placeholder visuals and icons
- Color schemes that match your topic or brand
This gives you a quick, editable version that’s already halfway there.
Step 3: Customize it your way
Now it’s your turn to fine-tune. You can:
- Edit text and titles directly
- Drag in your own images, logos, or brand assets
- Replace dummy data with real numbers or import spreadsheets
- Tweak layouts, fonts, and colors with drag-and-drop ease
- Ask the AI to “make it more visual,” “add a comparison chart,” or “simplify the text”
Everything stays editable, and you can work at your own pace without touching any code.
Step 4: Export, share, or present
Once you’re happy with the design, you can:
- Download it as a high-res image or PDF
- Generate a shareable link for others to view online
- Present slides directly from Piktochart in full-screen mode
- Embed your visual into a website or learning platform
- Save it as a reusable template for future projects
This smooth mix of AI assistance and full creative control is what makes Piktochart feel less like a tool and more like a design partner you can trust.
Use Cases for Piktochart AI
Great fit for:✔ Teachers and educators creating engaging lesson visuals
✔ Marketers designing campaign reports, social media graphics, or one-pagers
✔ Business professionals building clean presentations or KPI dashboards
✔ Content creators making infographics for blogs, videos, or newsletters
✔ Small teams who need polished visuals without hiring a designer
Not ideal for:✖ Users needing highly interactive or animated visuals
✖ Design professionals who prefer full creative freedom in tools like Figma or Adobe
✖ Complex branding projects requiring pixel-perfect layouts
✖ Heavy data analytics work with live dashboards or real-time updates
Limitations of Piktochart
1. Free plan has real limits
This comes up a lot in reviews and forums.
“I love how easy it is to use… but I hit the export limit on my second project.” (User review)
“You only realize how limited the free version is once you’re halfway through designing and can’t download your work in high resolution.” (Community feedback)
Bottom line: The free tier is good for trying things out, but serious use requires a paid plan if you want watermark-free downloads, brand control, or more storage.
2. AI-generated layouts can miss the mark
While the AI is a time-saver, it’s not always spot on.
- Some auto-generated designs feel too generic or templated
- It may misplace elements or suggest visuals that don’t match your content
- You’ll often need to tweak alignment, sizing, or chart labels manually
In short, the AI gives you a fast start, but not a perfect finish.
3. Limited customization for advanced branding
Piktochart supports brand kits, but it’s not built for pixel-perfect control.
- No full grid control or advanced spacing tools
- Limited options for custom typography and visual effects
- Hard to fully match exact brand guidelines for large teams
If you need deep design control, you may outgrow the platform and look to tools like Adobe Illustrator or Figma.
4. Real-time collaboration still feels basic
Compared to platforms like Canva or Google Slides, collaboration features can feel a little behind.
- No live cursors or real-time edits from multiple users
- Commenting and feedback tools are minimal
- Team workflows sometimes feel clunky with version tracking
It works for smaller teams, but fast-moving collaborative environments might find it restrictive.
Piktochart Pricing (Updated for January 2026)
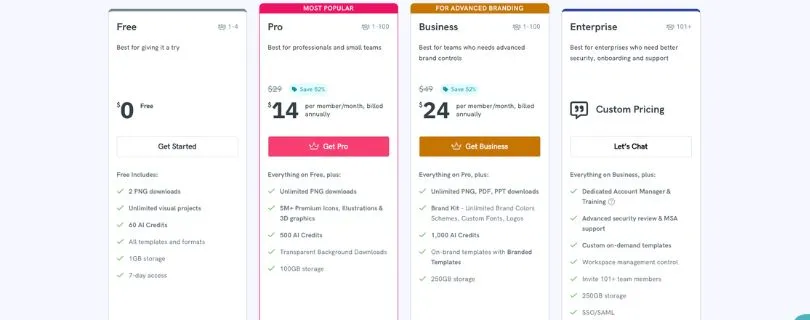
Free Plan – $0
- Basic access with limited features
- Includes a 7-day trial of full template access and AI credits
- Limited storage and a few downloads in PNG, PDF, or PPT formats
Great for testing the platform, playing around with templates, or getting a feel for the tools before upgrading.
Pro Plan – $14/month (billed annually) or $29/month (billed monthly)
- Full access to premium templates, brand kits, and assets
- Generous storage for uploads and design files
- Unlimited downloads and reusable visual projects
- Expanded AI credits for smart design assistance
This is the most popular option for individuals, freelancers, and small teams who want full creative freedom without constraints.
Business Plan – $24/month per user
- Everything in Pro, plus team collaboration tools
- More AI usage, larger storage capacity, and brand controls
- Ideal for small to mid-sized teams with steady visual content needs
Best suited for marketing departments, internal comms, or training teams creating visuals at scale.
Enterprise Plan – Custom Pricing
- Includes all Business features plus enterprise-grade security and onboarding support
- SSO integration, priority support, and custom template development
- Built for large organizations managing high-volume design needs with strict brand standards
Perfect for global teams, agencies, and companies that need consistency, control, and scale.
Special Plans (Education & Nonprofit)
- Education: $39.99/year for verified students and educators
- Nonprofit: $60/year for eligible nonprofit organizations
These discounted tiers make it more accessible for schools and mission-driven teams to create quality visuals without the premium price tag.
Pricing Summary
Piktochart stays affordable for casual users but really shines when used regularly. The Pro plan is packed with value if you’re creating visual content often. While the free tier is a solid introduction, serious users will likely need to upgrade to unlock the real power of the platform. If you’re working in teams or creating branded content at scale, Business or Enterprise makes more sense.
Piktochart AI Alternatives (2026 state)
1. Domo AI – best for data dashboards and live reporting
If your main focus is pulling in real-time data, building interactive dashboards, or sharing insights across teams, Domo AI stands out. It offers:
- Direct data source integrations (SQL, APIs, spreadsheets)
- Smart visualizations and auto-generated charts
- AI-assisted report generation
- Role-based access and collaboration tools
- Mobile-friendly dashboards
Domo is better suited for business intelligence use cases where live data and performance tracking matter more than static infographics.
Also Read:
Best Domo AI Alternatives
2. Adobe Express – best for rich visual content and branding
When design flexibility is the priority, Adobe Express delivers. It’s a strong choice if you want:
- More control over fonts, spacing, and image editing
- Access to Adobe’s creative library (photos, icons, videos)
- Multi-format support (social, print, video thumbnails, etc.)
- AI-powered text-to-image and content suggestions
- Seamless integration with other Adobe tools
While Piktochart is faster for data-driven visuals, Adobe Express wins when you want refined creative output with more customization.
Also Read:
Top Adobe Express Alternatives to Explore in 2026
3. InVideo – best for turning content into videos
If your content needs motion and storytelling, InVideo focuses on transforming text and visuals into professional-looking videos. It offers:
- Text-to-video generation using AI
- Templates for marketing, explainers, and social media
- Voiceovers, subtitles, and animations
- Drag-and-drop editing with smart scene suggestions
- Export options for YouTube, Instagram, and more
InVideo isn’t a direct competitor to Piktochart’s static visuals, but it’s a solid alternative when you’re ready to level up from infographics to dynamic content.
Also Read:
InVideo Competitors and Alternatives You Should Try
Is Piktochart AI Worth It?
Piktochart AI stands out when you need to turn content or data into something visual, fast:
- A pitch deck or team presentation
- A quick infographic for a blog or newsletter
- A report filled with charts and KPIs
- A lesson plan or visual aid for a classroom
- A one-pager or explainer for social media
- Something that looks clean without touching design software
If your project is focused on clarity, speed, and ease of use, Piktochart AI is a great fit — especially for non-designers who want professional-looking results without the learning curve.
But it may fall short when:
- You need pixel-perfect control over every design element
- You want full creative flexibility beyond templates
- You work with live data sources or real-time dashboards
- You’re part of a fast-paced team that needs deep collaboration tools
- You need full brand compliance and layout customization at an enterprise scale
For most individuals and small teams, Piktochart AI is worth it. It simplifies the visual side of communication, and it does it without making you feel like you’re stuck in a rigid template. Just know its limits before you build your workflow around it.
FAQ
Can Piktochart AI create full designs from scratch?
Yes. You can start with a plain prompt, and Piktochart AI will generate a complete visual layout with suggested text, charts, and icons.
Does Piktochart support team collaboration?
Yes. You can invite team members, share projects, and work together on designs, especially with the Business and Enterprise plans.
Is Piktochart good for non-designers?
Absolutely. It’s built for people with little to no design experience who still want professional-looking visuals without the steep learning curve.
Is Piktochart free?
There’s a Free plan, but most serious features like high-res downloads, brand kits, and premium templates are only available on the Pro plan or higher.
Can Piktochart make presentations, not just infographics?
Yes. Piktochart supports a wide range of formats including presentations, reports, social media graphics, and posters, all editable and exportable.